
Page 11 - MGMG Jan-June 2020 Final
P. 11
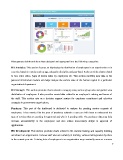
Management dashboards have been designed and segregated into the following categories:

HR Analytics: This section focuses on displaying the distribution of employees in an organization or in
a service based on metrics such as age, education discipline and pay-band. It also provides charts related
to hire retire ratios, types of leaves taken by employees etc. This section carefully uses data in the
personal information module and helps analyse the current state of the human capital in a particular
organization/ department.

HR Strength: This section provides charts related to category wise, service group wise and gender wise
distribution of employees. It also provides crucial data related to an employee’s retiring and tenure of
the staff. This section acts as a decision support system for employee recruitment and selection
strategies in government organizations.

Pendency: This part of the dashboard is dedicated to analyse the pending service requests of
employees. It has metrics like the span of pendency wherein a user can drill down to understand the
type of services that are pending for approval and who is it pending with. The pendency data may help
increase accountability in the employees and also reduce unnecessary delays in approval of
applications.

HR Development: This section provides charts related to the various training and capacity building
activities in an organization. It shows staff who are currently in training, various trainings taken by them
in the current year etc. Training data of employees in an organization may eventually serve as a source

                                                                                                                                         9